
Application of Fakopp 3D Arborsonic at BRIN Cibinong: Non-Destructive Acoustic Tomography for Internal Tree Structure Analysis
Empowering Researchers and Conservationists with Sound Wave Technology to Detect Hidden Decay, Hollows, and Fall Risks Without Harming Trees
Executive Summary
The Cibinong Science Center houses a collection of trees that are not merely landscape elements. Many are rare species, conservation collections, and trees with high historical and ecological value. The biggest challenge in managing trees that are decades or even centuries old is detecting internal damage that is not visible to the naked eye. Visual inspection is often insufficient to confirm the condition of wood structure inside the trunk. Fakopp 3D Arborsonic acts as an "X-ray machine" for trees. It works on the principle of sound wave tomography—sensors placed around the trunk send sound waves through the wood structure. Wave velocity differs when passing through healthy wood, decayed wood, or hollow cavities. The data is processed by software to produce 2D and 3D visual maps of internal trunk structure.
The Challenge
- !
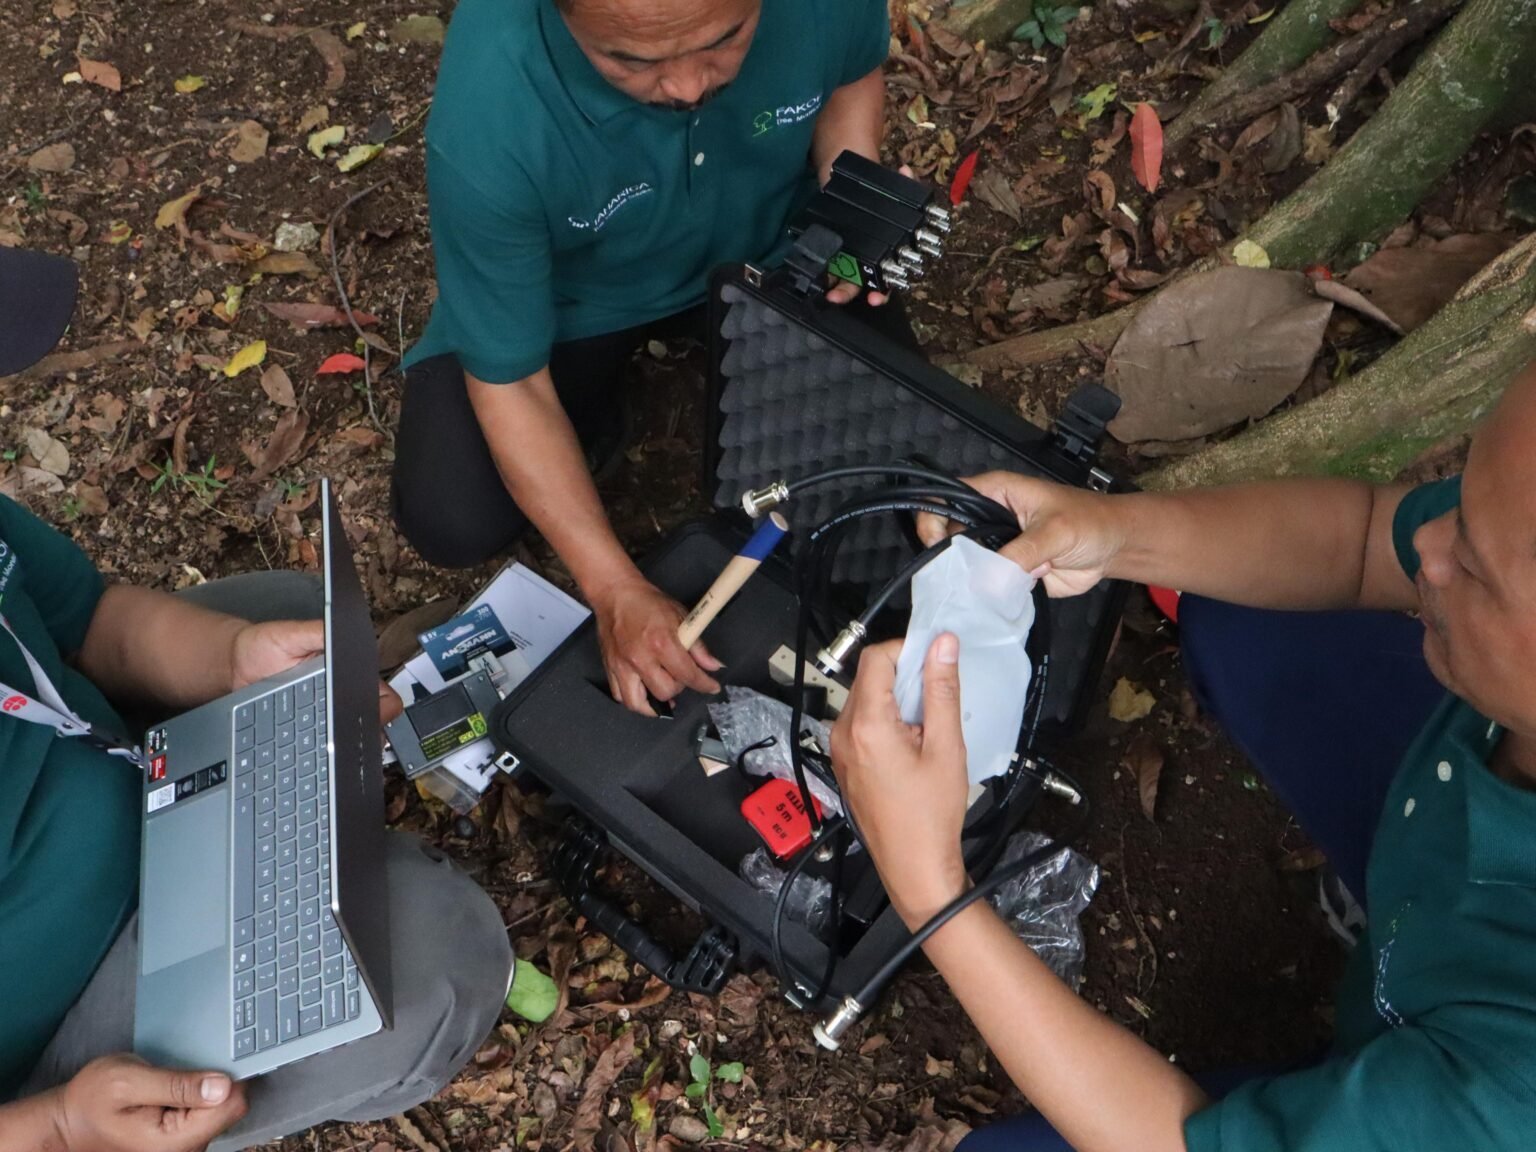
Fakopp 3D Arborsonic Non-Destructive Testing Deployment at BRIN Cibinong Science Center for Tree Risk Assessment and Conservation
Fakopp 3D Arborsonic offers four key advantages learned during training: First, non-destructive testing (NDT) allows examination without damaging living tree tissue—no large drilling or trunk cutting. Second, color-based visualization software translates sound wave velocity into an easy-to-understand color map: specific colors indicate healthy wood with optimal density, different colors indicate decay areas, and dark zones may indicate hollows. This visualization enables data-based decisions rather than visual assumptions. Third, risk analysis and hazard mitigation—data can calculate internal damage percentage, assess trunk stability, and predict fall risk, crucial for public safety in research and education areas like BRIN Cibinong. Fourth, documentation and periodic monitoring—scan results can be stored as digital archives, allowing longitudinal analysis of structural changes over time.
Strategic Approach
- 1
Place acoustic sensors around the circumference of the trunk at the measurement height. Multiple sensors are evenly spaced to surround the tree.
- 2
Send sound waves through the wood structure using a hammer or built-in impulse source. Wave velocity is measured between each pair of sensors.
- 3
The Fakopp software analyzes travel times of sound waves. Wave velocity differs between healthy wood, decayed wood, and hollow cavities—slower in decayed areas, faster in dense wood.
- 4
The software generates a color-coded tomographic image (2D cross-section or 3D model) showing internal conditions. Healthy wood appears in one color, decay in another, and hollows as dark zones.
- 5
Interpret the visualization to calculate percentage of internal damage, assess structural stability, and predict fall risk. Use results to prioritize interventions such as cabling, pruning, or removal based on objective data.
- 6
Store scan results as digital archives. Conduct periodic re-scans to monitor changes in internal structure over time, enabling early detection of progressive decay.
Business Impact